Table of content
How to Interpret a DISC Graph: A Complete Guide to Your "Real" Self
Learn how to interpret a DISC graph to understand personality types and workplace behavior. Explore traits, graphs, scores & take your DISC test today!
Table of content
Understanding how to interpret a DISC graph is the key to unlocking powerful insights about behavior, communication styles, and workplace dynamics. Whether you’re exploring your own personality or analyzing a team’s strengths, mastering DISC graph interpretation helps you make better decisions and build stronger relationships. In this guide, we’ll break down what each section of the graph means and show you how to apply these insights effectively in professional and personal settings.
What is a DISC Graph? Why Does It Matter in Personality Assessment?
A DISC graph is a visual representation of an individual's behavioral style based on the DISC personality model. This graph presents the intensity of the four core DiSC traits: Dominance, Influence, Steadiness, and Compliance. It highlights how each trait typically appears in both natural and adapted behaviors. Instead of lengthy reports, the graph provides a clear and concise overview of strengths and potential challenges across different situations.
Understanding how to interpret a DISC profile is crucial because it reveals patterns that explain how a person responds to challenges, interacts with others, and approaches rules or procedures.
For organizations, this insight supports better hiring decisions, team alignment, and leadership development. It enables managers to assign roles that match employees’ strengths and anticipate potential areas of conflict within teams.
By reading a DISC graph, individuals also gain self-awareness about their communication preferences and work habits. This awareness enables them to adapt to diverse environments and collaborate more effectively with colleagues who have contrasting styles.
The Four Personality Traits in the DISC Graph
The DISC graph provides valuable insights into four core personality traits, helping individuals and organizations understand behavior patterns. Each trait highlights different approaches to communication, decision-making, and collaboration.
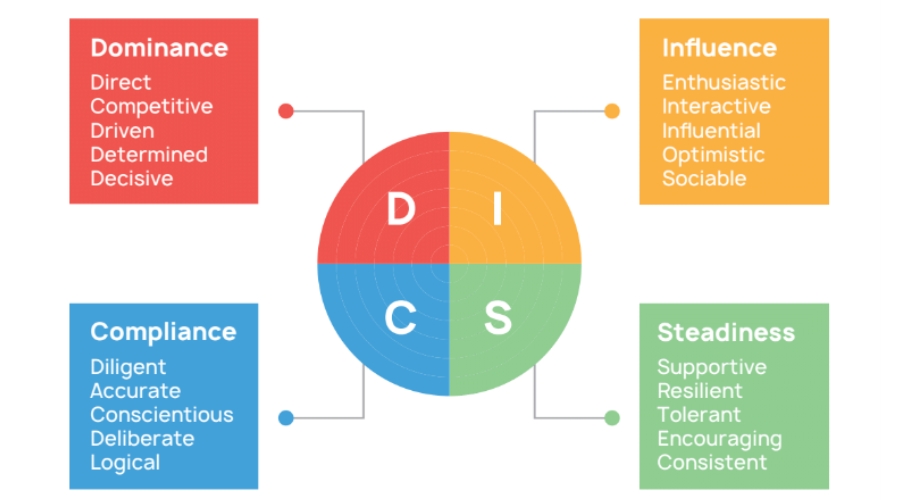
1. Dominance (D)
D types are assertive and confident, often taking charge and setting high standards. They thrive in fast-paced settings where quick decisions are needed but may struggle in slower environments. While their strong drive can inspire others, it can also come across as pushy or overly aggressive to some teammates.
2. Influence (I)
I-type individuals are strong in influence and teamwork. They’re usually outgoing, bring energy to group discussions, and help create a positive, cooperative atmosphere. Their strength lies in building rapport and keeping the peace, though they may sometimes overpromise or avoid conflict.
3. Steadiness (S)
Steadiness type measures how consistent and dependable a person is in their approach to work and relationships. People high in Steadiness are patient, loyal, and reliable. They value stability and thrive in team settings that need support and cooperation. While their consistency builds trust, they may resist sudden changes and prefer a gradual pace when adjusting.
4. Compliance (C)
Compliance (C) types are careful, accurate, and structured. They rely on logic and analysis before acting, and they’re great at spotting details and solving problems. However, they may hesitate in fast-paced or high-risk situations.
2 Type Of DISC Graph Results
1. Line Graph
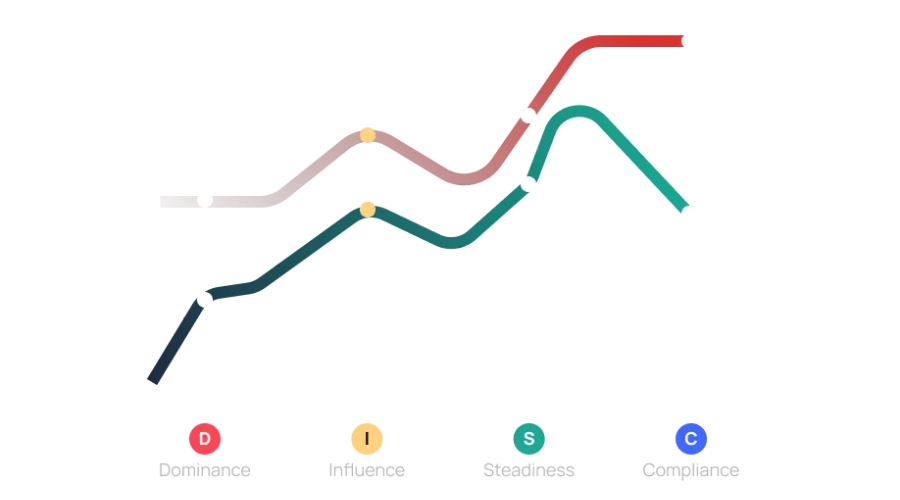
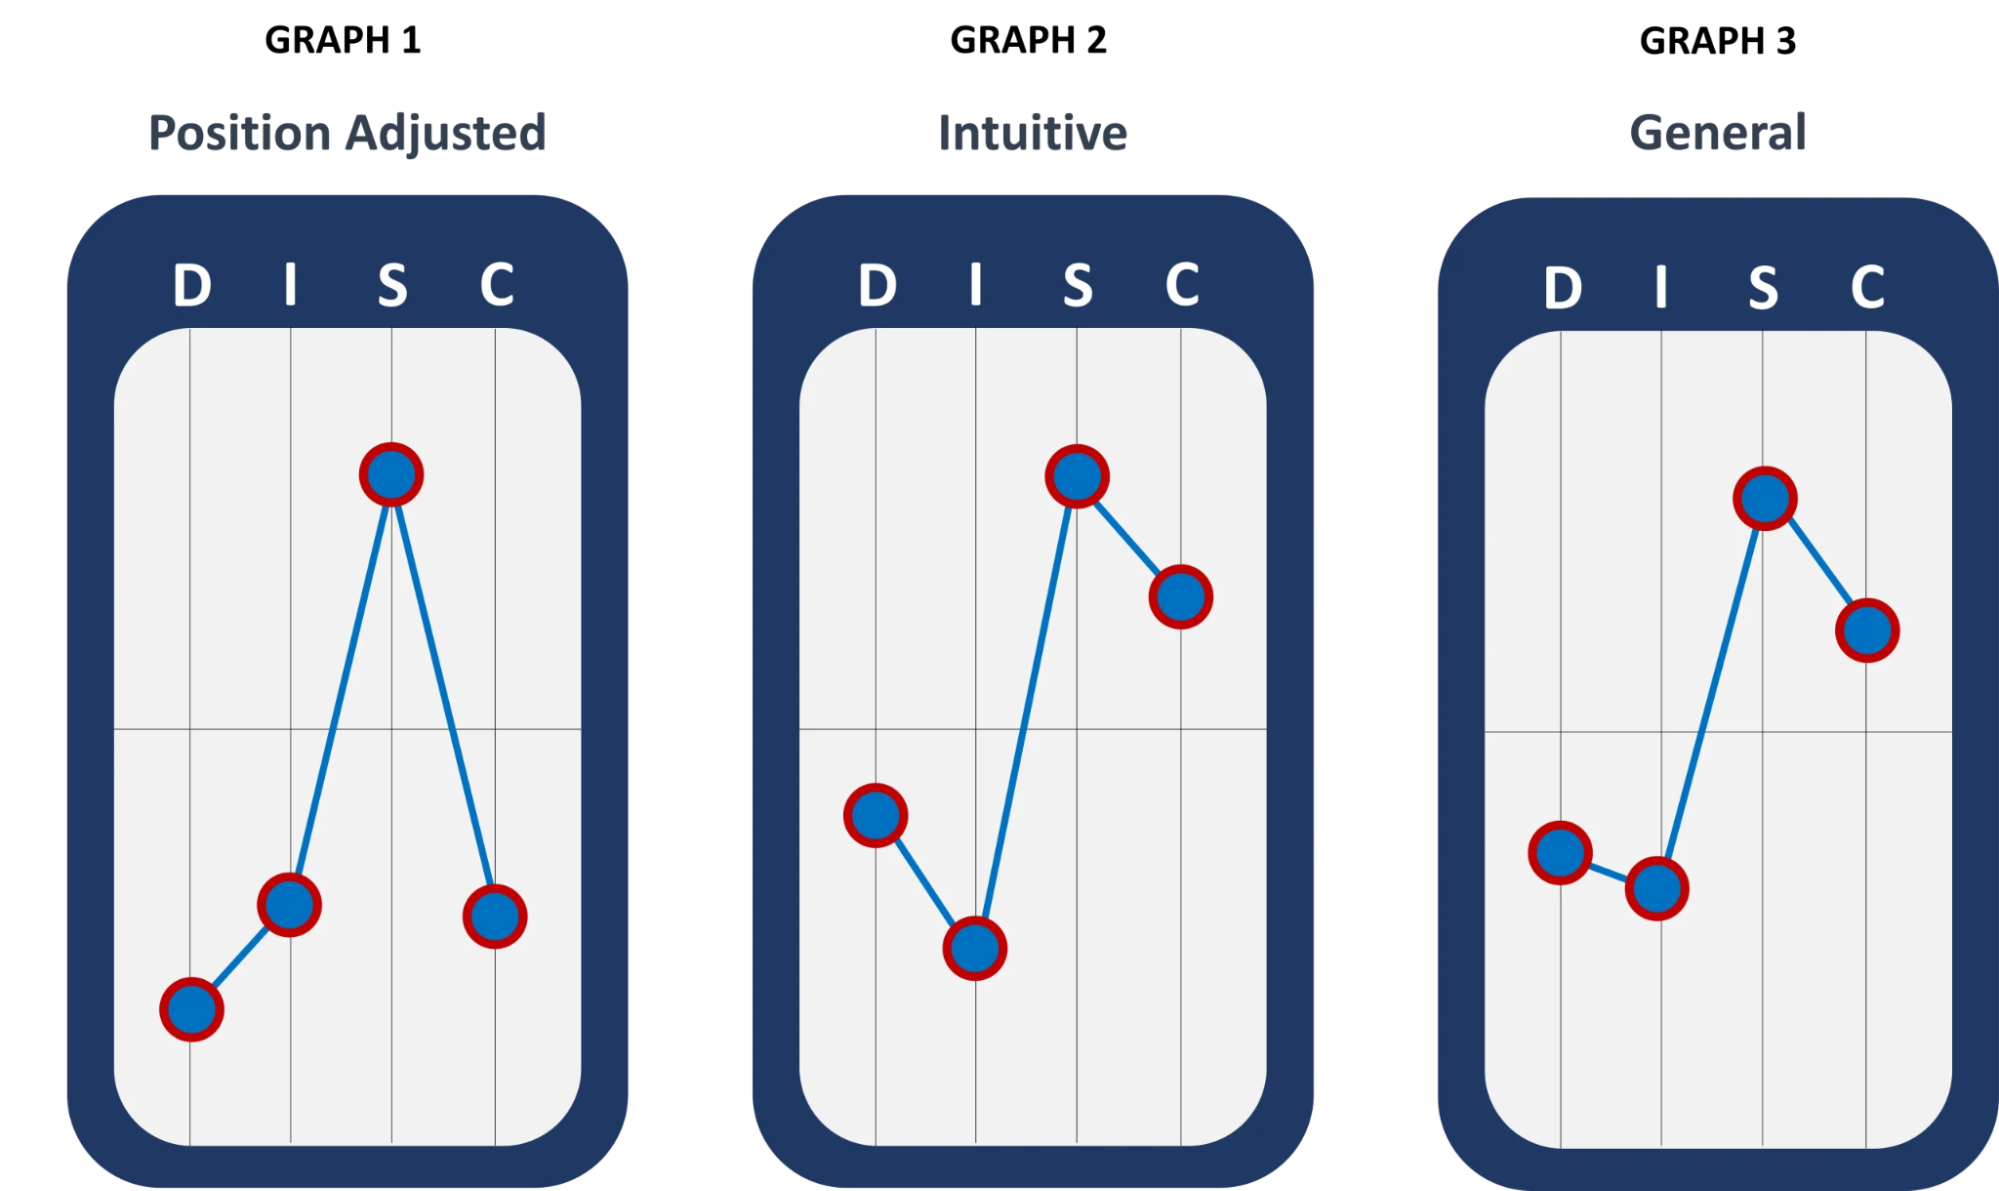
DISC profile graphs present three separate line charts, each displaying the four traits along the X-axis and corresponding scores along the Y-axis.
- Adapting Profile: This chart reflects how a person behaves in public or when they are trying to meet external expectations. The scores are based on questions about how others are likely to perceive them, such as whether they agree with statements like, “People see me as decisive.”
- Natural Profile: This chart represents the person’s core personality, showing behaviors that surface when they are relaxed or under stress. The scores here are derived from self-perception statements like, “I enjoy working independently.” Unlike the adapting profile, the natural profile tends to remain stable over time.
- Overall Profile: Some DISC providers include a third chart combining public and private traits for a more complete view of personality. However, individuals may not consistently display this combined profile, as they tend to alternate between their adapting and natural styles in different situations.
2. Circle or Slide Graph
This model positions the individual within a circular quadrant system or sliding spectrum, showing their dominant DISC style and sub-styles.
There are two common formats:
- 4-Type Model: Dominant D, I, S, or C.
- 12-Type Model: Adds blended types like “DI – Persuader”, “SC – Specialist”, or “CD – Analyzer”.
How To Read The DISC Test Results And Graphs
DISC assessment reports present visual tools to help individuals and organizations understand personality profiles effectively. Knowing how to interpret a DISC graph is essential to make sense of these insights. Below are the main types of charts used in these reports and what they reveal.
1. Reading profile line graph
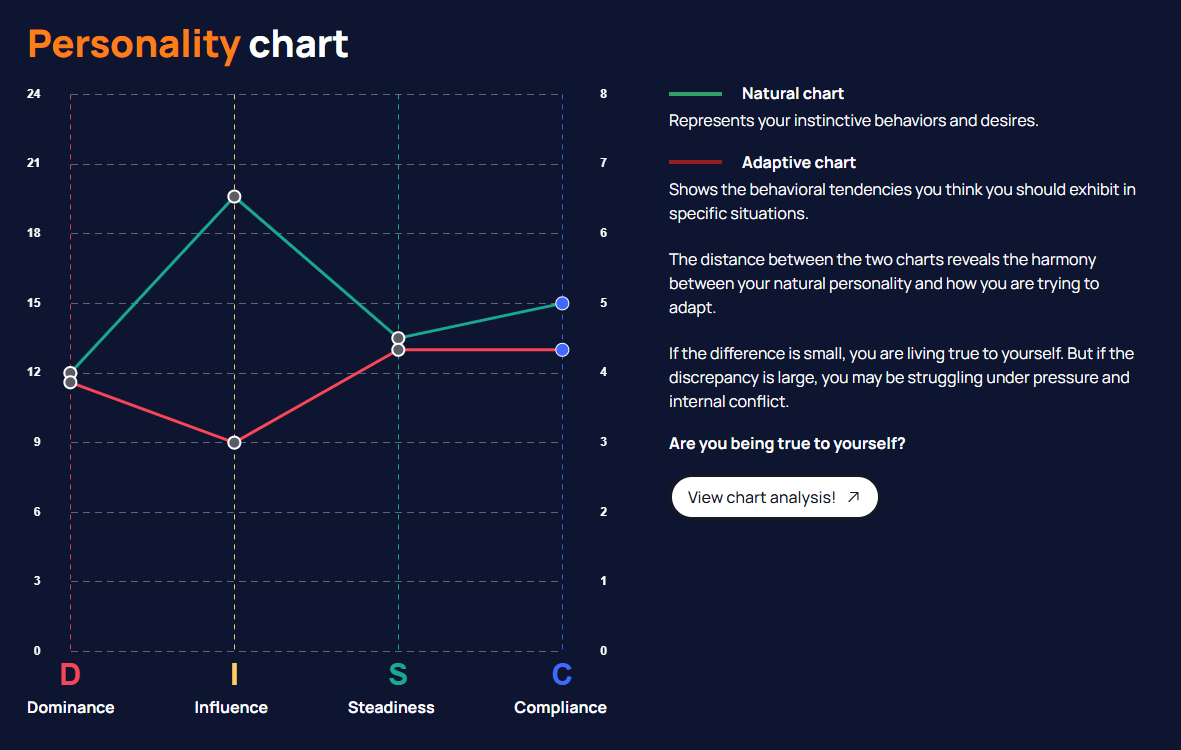
- Natural chart
The Natural chart illustrates a person’s innate behaviors and preferences without external influence. Using the baseline score of 12 as a reference, traits plotted above this line indicate dominant characteristics, while scores below suggest less prominent tendencies. For example, an Influence (I) score above the baseline (12) indicates a natural inclination for sociability and enthusiasm, while a Dominance (D) score below the baseline suggests a calmer, less forceful approach.
This chart reflects how someone naturally communicates, makes decisions, and responds to their environment. Understanding DISC test results interpretation is key to identifying core strengths and potential blind spots in a stress-free setting.
- Adaptive chart
The Adaptive chart shows behavioral patterns a person believes they should display in specific situations, such as at work or under pressure. Like the natural graph, points above 12 suggest emphasized traits, while lower points reflect reduced tendencies.
A noticeable gap between the Natural and Adaptive charts often reveals the level of behavioral adjustment. A small gap indicates alignment between one’s authentic self and situational behaviors, leading to greater harmony. In contrast, a large gap may signify that an individual is under significant pressure to conform, which could cause internal stress or even burnout if sustained over time.
When the gap widens, it’s essential to evaluate whether the environment or expectations are causing excessive strain. Adjustments, such as changing workplace dynamics or adopting coping strategies, may help restore balance and reduce psychological tension.
3. Understanding 4-Quadrant Circle Graph
The most widely used chart in DISC assessments is the circle divided into four quadrants, each representing one personality dimension: Dominance, Influence, Steadiness, and Compliance.
Shading within the quadrants reflects the extent to which an individual expresses each trait. While every person typically shows some level of shading in all quadrants, one or two may appear significantly more shaded. This indicates the traits that are most prominent in their behavior.
Additionally, many DISC circle charts feature a dot. This dot signifies the individual’s average score across all traits. The closer the dot is to the circle’s edge, the more strongly they exhibit the characteristic of the quadrant where the dot is placed.
4. Reading 12-Segment Slice Graph
Some DISC reports use a more detailed circle divided into 12 slices instead of four quadrants. Each slice represents a combination of two traits, allowing for a nuanced understanding of personality profiles.
For example, the Dominance quadrant includes:
- D (Dominant)
- DC (Independent)
- DI (Efficient)
Similarly, the Influence quadrant features:
- I (Influential)
- ID (Friendly)
- IS (Enthusiastic)
The Steadiness quadrant contains:
- S (Steady)
- SI (Thoughtful)
- SC (Persistent)
Lastly, the Compliance quadrant includes:
- C (Compliance)
- CD (Cooperative)
- CS (Sensitive)
In these charts, shading indicates how strongly an individual demonstrates each specific combination of traits. A single dot highlights the slice that best represents their overall personality profile. Understanding this chart requires knowing how to interpret a DISC graph effectively, especially for analyzing blended styles.
What’s Your DISC Test Results Meaning?
Understanding how to interpret a DISC graph is crucial for uncovering the behavioral tendencies behind your assessment results. A DISC profile reveals how much a person exhibits Dominance, Influence, Steadiness, and Compliance, with each trait scored on a scale from 0 to 100.
In most cases, individuals won’t display extreme results such as scoring the highest in one trait while showing no tendencies in others. Instead, people often reflect a blend of traits, such as combining high Dominance with moderate Compliance or balancing Influence and Steadiness.
The graph or chart you receive helps visualize these scores. To correctly analyze them, it’s important to consider not only the highest-scoring dimension but also how the remaining traits contribute to the individual’s overall behavioral style. How to interpret a disc graph example: Someone with high Dominance and low Steadiness may prefer fast-paced environments and decisive action, while a person with elevated Compliance and moderate Influence may thrive in roles requiring accuracy and collaboration.
Most DISC reports summarize these patterns using abbreviations like “D” for Dominance or combinations like “IS” for Influence-Steadiness, helping you quickly grasp how a person may behave in different contexts.
Applying the DISC Graph Insights in the Workplace
Understanding how to interpret a DISC graph effectively can lead to significant improvements in workplace dynamics.
To start, managers can leverage DISC test results graph insights to recognize and support their team members’ unique working styles. For instance, an employee with a high Influence score may thrive in collaborative environments, while someone with strong Compliance might excel in detail-oriented tasks that require precision and structure.
These insights also aid in forming effective teams. A balanced group may include individuals with Steadiness traits complemented by a member with high Influence to encourage communication and collaboration. However, teams with several Dominance-driven personalities might require careful management to avoid potential conflicts.

Recruitment processes can also benefit from the DISC graph. When hiring for roles demanding accuracy and consistency, candidates with a strong Compliance tendency may be a better fit. Conversely, for positions that require teamwork and adaptability, applicants with higher Influence or Steadiness could perform better.
Likewise, when considering promotions, DISC graph insights can guide decisions by highlighting candidates who demonstrate leadership-oriented qualities. Profiles with Dominance or Influence often align well with positions of authority, whereas other styles might shine in supporting or specialist roles.
While the DISC graph offers valuable perspectives, it should complement, not replace, other decision-making factors during hiring or advancement discussions. Used thoughtfully, it provides managers with actionable knowledge to enhance both individual and team success.
Take the DISC Assessment to Discover Your Personality Graph
If you want to unlock deeper insights into your natural behaviors, motivations, and workplace strengths, taking a DISC assessment is the first step. The results will generate your unique personality graph, helping you understand where you fall within the Dominance, Influence, Steadiness, and Compliance dimensions.
By learning how to interpret a DISC graph, you’ll understand your DISC assessment results meaning and gain clarity about your preferred working style, communication patterns, and areas for growth. This knowledge can be invaluable whether you’re exploring career options, improving team collaboration, or preparing for leadership roles.
Ready how do you read your DISC results? Take a DISC assessment today and start your journey to understanding yourself and others more effectively.
FAQs
1. Why is it important to interpret a DISC graph correctly?
Accurate interpretation of a DISC graph is critical because it provides insights into someone’s core behavioral tendencies. It helps individuals identify their strengths and potential blind spots. For managers, reading a DISC graph correctly ensures better team alignment and role assignments. Misinterpreting it can lead to poor communication or mismatched responsibilities. By learning how to interpret a DISC graph, you gain actionable knowledge to improve relationships and productivity in both personal and professional settings.
2. What does a low Influence score indicate in DISC results?
A low Influence (I) score suggests the individual prefers to focus on tasks rather than people-oriented interactions. They may be more reserved, thoughtful, and cautious in expressing ideas. While they might not seek the spotlight, they often excel in roles requiring focus and analytical thinking. When interpreting this on a DISC graph, understand that a lower I does not mean poor social skills, it simply reflects a preference for quieter, less outgoing environments.
3. How can I use DISC graphs to improve team collaboration?
DISC graphs can be a powerful tool for building effective teams. By analyzing each member’s behavioral style, you can balance personality types to promote harmony and productivity. For example, pairing high Influence individuals with high Steadiness personalities can encourage both creativity and stability. Understanding how to interpret a DISC graph allows managers to assign roles that align with natural strengths, avoid personality clashes, and enhance communication within the team.
4. How do I know which DISC type is best for leadership?
Leadership potential can exist across all DISC types, but certain traits stand out in the graph. High Dominance and Influence scores often align with proactive decision-making and team motivation. However, leaders with Steadiness and Compliance can excel in roles requiring consistency and detail orientation. Interpreting the DISC graph carefully helps identify the unique leadership strengths of each personality type, rather than assuming one style fits all.
Conclusion
Learning how to interpret a DISC graph allows you to uncover the deeper meaning behind your behavioral patterns and communication style. By understanding your DISC assessment results meaning, you can make more informed decisions in both professional and personal relationships. These insights are especially valuable for improving teamwork, leadership, and self-awareness. Take the next step today, explore your DISC graph and discover DISC explanation personality can guide you toward greater success and stronger connections.


Don't Let Your Potential Stay Hidden!
Take the DISC test today and discover your unique 'YOU', with deep insights into your true personality and potential.

Represents your instinctive behaviors and desires.
Shows the behavioral tendencies you think you should exhibit in specific situations.
Related articles
You may also be interested in
 DISCMay 29, 2026
DISC Profile Activities for Team Building, Communication, & Workplace
Discover how DISC profile activities enhance team collaboration and communication. Apply practical exercises to build self-awareness and apply at work.
 DISCMay 29, 2026
DISC Assessment for Hiring: How to Use DISC to Hire Better Candidates
Learn how to use DISC assessment for hiring responsibly. Discover how DISC helps evaluate work style, team fit, communication, onboarding, and hiring decisions.
 DISCMay 21, 2026
What Does the DISC Assessment Measure? Key Behavioral Styles Explained
Discover what does the DISC assessment measure and understand your behavior & communication style. Learn how insights can improve teamwork and personal growth.