


Table of content
IQ Score Chart: IQ Ranges, Levels and Percentiles
IQ score chart from 55 to 160: levels, percentiles, good scores by age and test scales explained. Check your own score with the free IQ test.
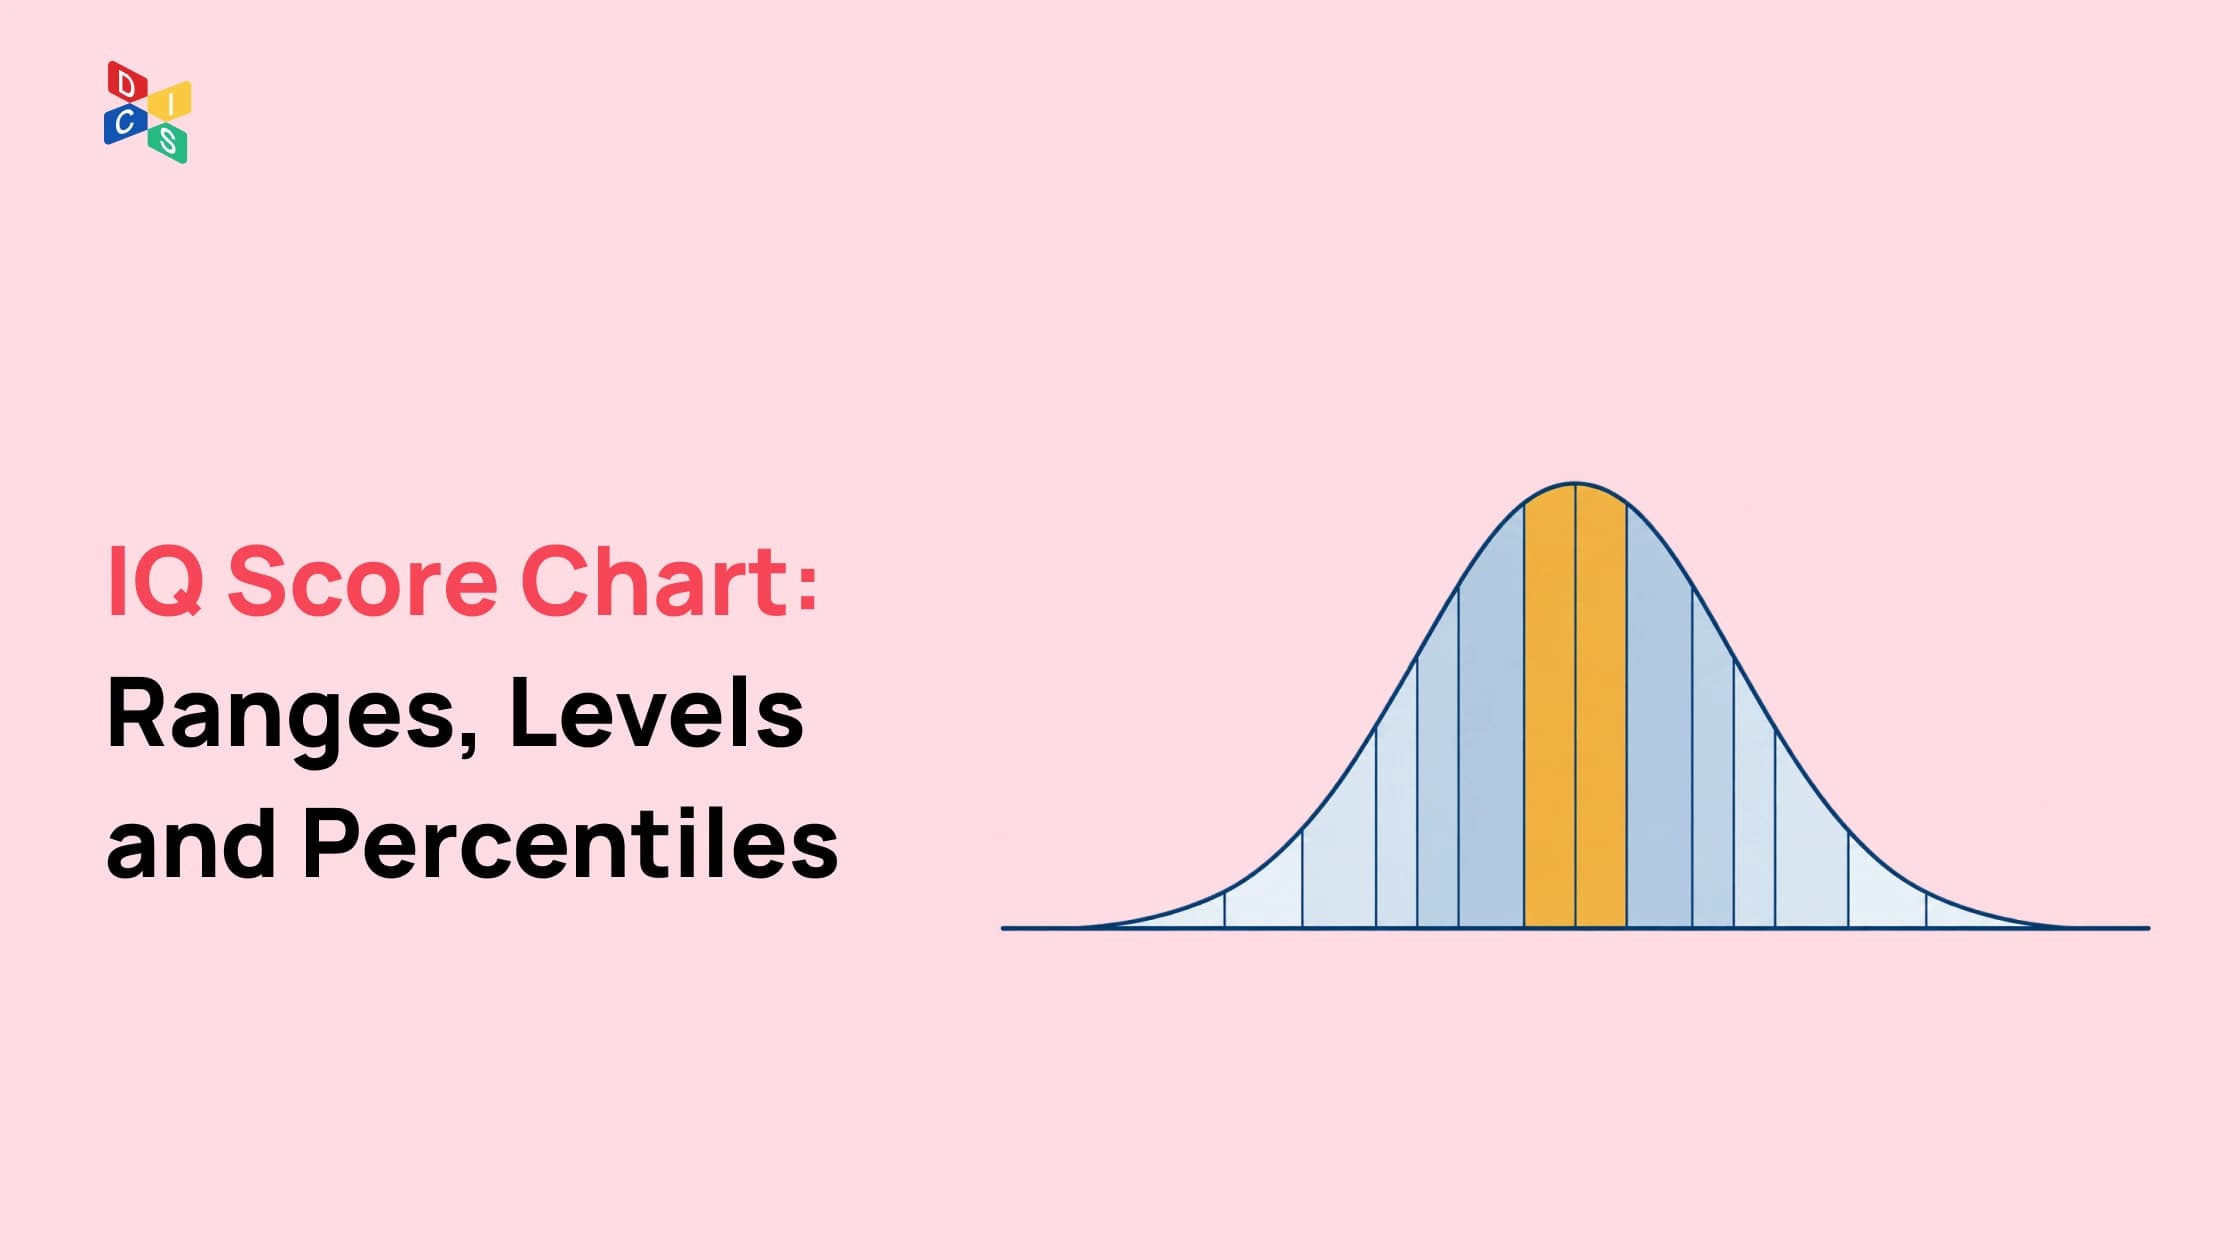
Table of content
What does a number like 112 or 127 actually say about your mind? An IQ score chart answers that by placing any score on a fixed scale where 100 is the average and every 15 points equals one standard deviation. About half of all people score between 90 and 109, roughly two in three fall between 85 and 115, and a score of 130 sits near the 98th percentile. This guide covers every IQ range, the label tests attach to it, the percentile behind it, how age and test choice change the picture, and the margin of error that comes with any single result.
What Is an IQ Score Chart?
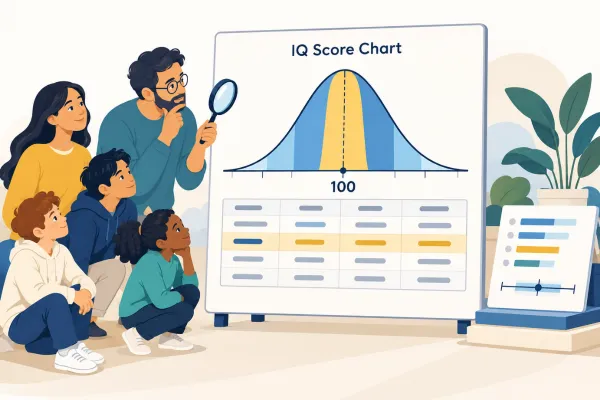
An IQ score chart is a reference table that converts an IQ score into a descriptive level, a percentile and a share of the population. It rests on the standard scale for IQ scores used by modern tests, where 100 marks the average of a large comparison group and each 15 points equals one standard deviation from that average.
IQ stands for intelligence quotient. Unlike a school exam, an IQ score is not a percentage of correct answers. A score of 85 does not mean you answered 85% of the questions correctly. It means your performance landed one standard deviation below the average of people your age who took the same test during its norming phase.
That is why an IQ chart usually has four columns. The first gives the score range. The second gives the descriptive label the test publisher uses, such as Average or High Average. The third gives the percentile, which shows how many people in the norm group scored at or below that point. The fourth gives the share of the population expected to fall inside the band.
An IQ score is a rank turned into a number. It tells you where a result sits among people your age, not how many questions you got right or how much you are worth.
Charts look precise, but they describe a statistical model. A real report from a psychologist adds the test name, the confidence interval and the scores for each ability the test measured. A chart is the map. Your report, or the test you took, is the location you place on it.
IQ Score Chart: What Are the IQ Ranges and Levels?
The IQ ranges on a standard IQ score chart run in seven bands, from 69 and below (Extremely Low) to 130 and above (Very Superior). The Average band, 90 to 109, holds about 50% of people. Moving outward, each pair of neighboring bands holds 16.1%, then 6.7%, then 2.2% of the population on each side.
| IQ range | Level (WAIS-IV label) | Percentile | Share of people | Rough rarity |
|---|---|---|---|---|
| 130 and above | Very Superior | 98th and above | 2.2% | About 1 in 44 score 130 or higher |
| 120 to 129 | Superior | 91st to 97th | 6.7% | About 1 in 11 score 120 or higher |
| 110 to 119 | High Average | 75th to 90th | 16.1% | About 1 in 4 score 110 or higher |
| 90 to 109 | Average | 25th to 74th | 50% | Half of all people |
| 80 to 89 | Low Average | 9th to 24th | 16.1% | About 1 in 4 score 89 or lower |
| 70 to 79 | Borderline | 2nd to 8th | 6.7% | About 1 in 11 score 79 or lower |
| 69 and below | Extremely Low | Below the 2nd | 2.2% | About 1 in 44 score 69 or lower |
This IQ classification follows the labels of the Wechsler Adult Intelligence Scale, Fourth Edition (WAIS-IV), which many charts still copy. The shares in each IQ score range are symmetrical because the scale is built on a bell curve. The table reads the same from both ends: 2.2% at each extreme, 6.7% in each of the next bands, and 16.1% in each band beside the middle.
130 and Above: Very Superior
Scores of 130 and higher sit two or more standard deviations above the mean. About 2.2% of people land here. This band includes the 98th percentile line used by high-IQ societies and many gifted education programs. People who score here often pick up abstract patterns quickly, yet motivation, knowledge and opportunity still decide what they do with that speed.
120 to 129: Superior
A score from 120 to 129 sits between the 91st and 97th percentiles, so about 6.7% of people fall here. It is well above average. In practical terms, people in this band usually handle complex, multistep reasoning without much strain. Newer Wechsler editions call this band Very High instead of Superior, but the numbers and percentiles are unchanged.
110 to 119: High Average
The High Average band covers the 75th to 90th percentiles and holds about one in six people. A score here is above the middle of the population but common enough that it rarely feels unusual day to day. Someone at 115 scored higher than about 84% of the norm group, which is a meaningful edge on reasoning tasks.
90 to 109: Average
Half of all people score between 90 and 109. This band is wide on purpose. A 91 sits near the 27th percentile, while a 109 sits near the 73rd percentile, so two people with Average scores can still differ in real ways. An Average score reflects the reasoning level that most everyday work, study and life tasks are designed around.
80 to 89: Low Average
Scores from 80 to 89 cover the 9th to 24th percentiles, about one in six people. This band is part of normal variation. People in this range manage everyday life, study and many jobs well, especially when they have time, practice and clear instructions. A Low Average result is a description of test performance, not a verdict on ability to learn or succeed.
70 to 79: Borderline
The Borderline band runs from about the 2nd to the 8th percentile and holds about 6.7% of people. Newer Wechsler editions replace this label with Very Low. Scores here are strongly affected by testing conditions such as anxiety, unfamiliar formats, language and fatigue, so a single result in this band is a reason to look more closely, not to draw conclusions.
69 and Below: Extremely Low
Scores of 69 and below fall under the 2nd percentile, about 2.2% of people. A clinician never identifies any condition from an IQ number alone. The American Psychiatric Association's DSM-5-TR requires a full evaluation that also looks at everyday adaptive skills and developmental history. An online result in this range says nothing diagnostic and is worth discussing with a licensed professional if it raises a concern.
How Does the IQ Test Scale Work?
The IQ test scale is a standard score scale built on a normal distribution, also called a bell curve. Test makers set the average of a large norm group at 100 and the standard deviation at 15. As a result, about 68% of people score between 85 and 115 and about 95% score between 70 and 130.
The scale did not start this way. In 1905, Alfred Binet and Théodore Simon in France built the first practical intelligence test to identify school children who needed extra help. In 1912, German psychologist William Stern proposed dividing mental age by chronological age. Lewis Terman at Stanford University adopted that idea in his 1916 Stanford-Binet test, multiplying the result by 100 to create the original ratio IQ.
Ratio IQ worked poorly for adults, because mental age stops climbing in adulthood. In 1939, David Wechsler replaced it with the deviation IQ in the Wechsler-Bellevue scale. A deviation IQ places a person on the bell curve of same-age peers. Every major modern test uses this approach, which is why the chart you see today is a picture of a bell curve.
The math is short. Subtract 100 from the score, then divide by 15. The result is a z-score, the number of standard deviations from the mean. A score of 130 gives a z-score of 2, and the area under the normal curve to the left of that point is about 97.7%, the percentile. Going the other way, IQ equals 100 plus 15 times the z-score.
- About 68% of people score within one standard deviation of the mean: 85 to 115.
- About 95% score within two standard deviations: 70 to 130.
- About 99.7% score within three standard deviations: 55 to 145.
One detail surprises many readers. IQ points are equal steps on the scale, but they are not equal steps in people. Going from 100 to 115 moves you past about 34% of the population. Going from 130 to 145 moves you past only about 2%, because very few people are left in that tail. That is why small differences at the high end look dramatic in percentile terms.
IQ Percentile Chart: Where Does Each Score Fall?
An IQ percentile is the share of the norm group that scored at or below your result. On the standard scale, IQ 100 is the 50th percentile, 115 is about the 84th, 120 is about the 91st, 130 is about the 98th and 145 is about the 99.9th. A percentile is not the percentage of questions answered correctly.
| IQ score | Approximate percentile | How rare (at or beyond this score) |
|---|---|---|
| 55 | 0.1st | About 1 in 741 score this low or lower |
| 60 | 0.4th | About 1 in 261 |
| 65 | 1st | About 1 in 102 |
| 70 | 2nd (2.3) | About 1 in 44 |
| 75 | 5th (4.8) | About 1 in 21 |
| 80 | 9th | About 1 in 11 |
| 85 | 16th | About 1 in 6 |
| 90 | 25th | About 1 in 4 |
| 95 | 37th | About 1 in 3 |
| 100 | 50th | The middle of the group |
| 105 | 63rd | About 1 in 3 score this high or higher |
| 110 | 75th | About 1 in 4 |
| 115 | 84th | About 1 in 6 |
| 120 | 91st | About 1 in 11 |
| 125 | 95th | About 1 in 21 |
| 130 | 98th (97.7) | About 1 in 44 |
| 135 | 99th | About 1 in 102 |
| 140 | 99.6th | About 1 in 261 |
| 145 | 99.9th | About 1 in 741 |
| 150 | 99.96th | About 1 in 2,300 |
| 160 | 99.997th | About 1 in 31,600 |
The figures above are theoretical values for a scale with a mean of 100 and a standard deviation of 15. A real test report uses that test's own norm tables, which can shift a percentile by a point or two, especially near the top and bottom of the scale.
People often search the other way, starting from a percentile. These are the approximate scores that mark common cutoffs on the same scale:
| Population group | Percentile | Approximate IQ |
|---|---|---|
| Highest 10% | 90th | 119 |
| Highest 5% | 95th | 125 |
| Highest 2% | 98th | 131 |
| Highest 1% | 99th | 135 |
| Highest 0.1% | 99.9th | 146 |
The exact 98th percentile on this model is about 130.8, which is why some sources quote 130 and others quote 131. Both describe the same point on the curve.
Curious where your own result might land? The IQ test on discpersonalities.com includes 25 questions with a 30-minute time limit and shows a basic result as soon as you finish. Treat that number as an indicator to read against this chart, not as a clinical score.
What Is a Good IQ Score?
A good IQ score is any score in or above the Average range of 90 to 109, because that range covers the reasoning that most work, study and everyday tasks require. A score of 110 or higher is higher than about three in four people, and 120 or higher is higher than about nine in ten.
There is no official cutoff for a good IQ. Some summaries call 85 or higher good, because 85 to 115 covers the middle two thirds of people. Others start at 110, the beginning of High Average. Both views are reasonable because the question depends on the purpose. For daily life, an Average score does almost everything most people need it to do.
A better question is "good for what?" Graduate study and highly technical roles tend to draw more people from the High Average band and above. Yet people with every kind of score build successful careers, because knowledge, practice, communication and steady effort shape results as much as reasoning speed does. A difference of five points between two people is usually smaller than the error in either score.
It also helps to separate the label from the person. The label describes one performance on one test on one day. Someone who scores in the High Average range is not a "high average person." People are far more than a single number, and the chart is only useful when it is read that way.
What Is a Good IQ Score by Age?
A good IQ score is the same number at every age, because modern IQ tests are age-normed. Each person is compared only with people their own age, so the average stays 100 for a 10-year-old, a 40-year-old and a 75-year-old, and a score of 110 is above average in every age group.
What changes with age is raw ability, not the scaled score. An 8-year-old and a 16-year-old who both score 100 are each performing at the average for their age. The 16-year-old can still solve far harder problems in absolute terms. The IQ number simply shows that both are where a typical person their age would be.
Psychologists Raymond Cattell and John Horn described two broad kinds of ability that help explain age patterns. Fluid intelligence is the ability to solve new problems on the spot, and it tends to peak in young adulthood. Crystallized intelligence is accumulated knowledge, such as vocabulary and general facts, and it often keeps growing into middle age and later. A full-scale score blends both, which is one reason scores stay fairly stable across adulthood.
Different tests cover different ages, and each has its own norm group:
| Test family | Typical age range | Average score |
|---|---|---|
| Wechsler Preschool and Primary Scale of Intelligence (WPPSI) | About 2 years 6 months to 7 years 7 months | 100 |
| Wechsler Intelligence Scale for Children (WISC) | 6 to 16 | 100 |
| Wechsler Adult Intelligence Scale (WAIS) | 16 to 90 | 100 |
| Stanford-Binet Intelligence Scales, Fifth Edition | 2 to 85 and older | 100 |
Charts that show a different "average IQ" for each age usually mix up raw scores and scaled scores, or they use outdated norms. On a properly normed modern test, 100 is the average at every age by design. For young children, scores also move more from year to year, so one early result should be read as a snapshot rather than a lifelong label.
How Smart Is an IQ of 120?
An IQ of 120 sits at about the 91st percentile, which means it is higher than roughly 91 of every 100 people in the norm group. Most tests label 120 to 129 as Superior or Very High. About 1 in 11 people score 120 or higher, and 120 is 10 points below the 130 line that many gifted programs use.
In everyday terms, a 120 suggests that abstract reasoning, pattern recognition and multistep problems tend to feel manageable rather than overwhelming. People at this level often learn new systems quickly when the material interests them. Still, the number describes test performance. It does not describe creativity, character, emotional skill or how hard someone works.
Error matters at this level too. On a clinical test, a 120 is better pictured as roughly 115 to 125. On a short online test, the realistic band is wider. If you scored 118 one week and 123 the next, both results can describe the same underlying ability.
People with scores around 120 appear in every field, from trades to research to the arts. The score can open conversations about learning style and challenge level, but it does not decide which career fits you. Interests, values, skills and working style matter at least as much.
What IQ Score Is Considered Genius or Gifted?
No IQ test defines genius. Lewis Terman's 1916 Stanford-Binet table labeled scores above 140 as "near genius or genius," and the word stuck. Today, many gifted programs start near 130, about the 98th percentile, and Mensa International admits people who score at or above the 98th percentile on an approved, supervised test.
On the standard scale, 140 is about the 99.6th percentile, or roughly 1 in 261 people. A score of 145 is about 1 in 741, and 160 is about 1 in 31,600. Those are statistical rarities, but psychologists do not use "genius" as a formal category. Genius is a cultural word for exceptional achievement, and achievement depends on far more than a test score.
"Gifted" is closer to a technical term, mostly in education. The Stanford-Binet Fifth Edition labels 130 to 144 as "gifted or very advanced" and 145 to 160 as "very gifted or highly advanced." School districts set their own criteria, and many combine test scores with grades, teacher input and work samples.
Mensa's 98th percentile rule shows why the test name matters. The same rank produces different numbers on different scales:
| Scale | Standard deviation | Score at the 98th percentile |
|---|---|---|
| Wechsler tests and Stanford-Binet 5 | 15 | 130 |
| Older Stanford-Binet forms | 16 | 132 |
| Cattell Culture Fair scale | 24 | 148 |
Why Do IQ Classifications Differ Between Tests?
IQ classifications differ because each publisher chooses its own labels, and some tests use a different standard deviation. The Wechsler Adult Intelligence Scale and Stanford-Binet 5 use 15 points, older Stanford-Binet forms used 16, and the Cattell scale uses 24, so one percentile can appear as 130, 132 or 148.
The names of IQ levels have changed over time while the numbers have stayed put. With the WISC-V in 2014, Pearson moved the Wechsler family to more neutral labels, and the WAIS-5, released in 2024, kept them. Pearson describes these labels as communication aids rather than natural categories, which is a useful reminder that the boundaries are conventions.
| IQ range | WAIS-IV label | WISC-V and WAIS-5 label |
|---|---|---|
| 130 and above | Very Superior | Extremely High |
| 120 to 129 | Superior | Very High |
| 110 to 119 | High Average | High Average |
| 90 to 109 | Average | Average |
| 80 to 89 | Low Average | Low Average |
| 70 to 79 | Borderline | Very Low |
| 69 and below | Extremely Low | Extremely Low |
Early 20th century charts used labels that are now considered offensive and have been retired. Modern labels aim to describe a score's position without judging the person. When you compare results from different sources, focus on the percentile, the test name and the edition rather than the adjective.
Scale differences also explain many confusing numbers online. A score of 148 on a scale with a standard deviation of 24 equals about 130 on a Wechsler test. A certificate showing 132 often comes from a scale with a standard deviation of 16. Before comparing any two scores, convert them to the same scale or compare their percentiles directly.
How High Does the IQ Scale Go?
The IQ measurement range of most modern tests runs from about 40 to 160. Beyond that, too few people in the norm group score high or low enough to set reliable cutoffs. Reported scores above 160 usually come from extrapolation, older ratio formulas or scales with a larger standard deviation.
Every test has a ceiling and a floor. The ceiling is the highest score the test's items and norms can measure with confidence. Near the ceiling, one or two extra correct answers can move the reported score by many points, so very high numbers carry large uncertainty. The same is true at the floor, where a test has too few easy items to separate low scores clearly.
Famous claims of IQ 180 or 200 usually trace back to the old ratio formula. Under ratio IQ, a 6-year-old performing like a 12-year-old would score 200. Deviation IQ does not work that way, and no modern test norms adults at that level.
Short online tests have lower ceilings in practice. With 25 to 40 items, a test can show that someone is well above average, but it cannot reliably separate 140 from 150. If a result lands near the top of a short test, the meaningful message is "high," not the exact digits.
How Accurate Is an IQ Score?
An IQ score is an estimate with a margin of error, not an exact measurement. Clinical tests such as the WAIS have a standard error of measurement of about 2 to 3 points for the full-scale score, which puts a 95% confidence band about 5 points either side. Short online tests carry wider error.
Read every IQ score as a band, not a point. A 120 on a clinical test is better pictured as 115 to 125 than as a single line on a chart.
Several things can move a score on a given day:
- Sleep, illness and stress, which slow processing speed and working memory.
- Test anxiety, which can lower performance on timed items.
- Language, since items with words favor fluent speakers of the test language.
- Rushing, which costs points on any timed reasoning task.
- Practice, because taking a similar test again often raises the score by a few points.
Norms also age. The Flynn effect, named after researcher James Flynn, describes a rise of about 3 IQ points per decade in raw test performance during much of the 20th century. Publishers renorm their tests every 10 to 20 years so that 100 still marks the current average. A score on an old edition can run higher than the same person would earn on a newer one.
Online tests differ from supervised tests in three main ways. They usually have fewer items, so measurement error is larger. Their norm groups are often web samples rather than samples matched to the national population. And nobody checks the conditions, so distractions and retakes are common. None of that makes an online score useless. It makes it an indicator, worth reading as a range and confirming with a professional assessment when a decision depends on it.
How to Read Your Score on an IQ Score Chart
To read your score on an IQ score chart, first check which test and scale produced it, then find its band and percentile, then widen it into a range that reflects measurement error. Read a clinical result as about 5 points either side and a short online result as about 10 points either side.
- Check the test and scale: Look for the test name and edition. Wechsler tests and the Stanford-Binet 5 use a standard deviation of 15, which matches the chart in this guide.
- Convert if needed: If the report uses a standard deviation of 16 or 24, find the percentile first, then read the matching score on the 15-point scale.
- Find the band and percentile: Locate your score in the IQ ranges table and the percentile table. Note both the label and the percentile, because the percentile is the more precise fact.
- Widen it into a range: Add and subtract about 5 points for a clinical score or about 10 for a short online score. That range is the claim the score can support.
- Look beyond the total: If your report lists separate abilities, such as verbal reasoning, working memory or processing speed, read them as a profile. Two people with the same total can have very different strengths.
- Decide the next step: For curiosity and self-reflection, the chart is enough. For school placement, clinical questions or legal matters, ask a licensed psychologist for a supervised assessment.
If you take the IQ test on discpersonalities.com, the same steps apply. The test and its basic result are free, and a detailed report is available as a paid option. Take it when you are rested, give it the full 30 minutes and read the result as a starting point for reflection rather than a fixed label.

What Can an IQ Score Predict, and What Can It Not?
An IQ score predicts performance on reasoning-heavy tasks, such as school learning and complex problem solving, better than it predicts creativity, relationships or life satisfaction. It is a useful signal for one cluster of abilities, while much of what shapes outcomes, including effort, knowledge, emotional skills and opportunity, sits outside the number.
Research shows clear but moderate links. A widely cited 1998 review by Frank Schmidt and John Hunter estimated that general mental ability correlates with job performance at about 0.51. A 2022 reanalysis led by Paul Sackett in the Journal of Applied Psychology revised that estimate down to about 0.31 after correcting for statistical assumptions in older studies. Either way, most of the difference in job performance between people is explained by other factors.
Education matters in both directions. A 2018 meta-analysis by Stuart Ritchie and Elliot Tucker-Drob estimated that each additional year of schooling raises IQ scores by about 1 to 5 points. Scores and schooling feed each other, which is one reason an IQ chart describes a moment rather than a destiny.
IQ tests also leave out several abilities people use every day:
- Emotional intelligence, the ability to recognize and manage emotions in yourself and others, popularized by psychologist Daniel Goleman's 1995 book.
- Creativity and original thinking, which standard reasoning items rarely capture.
- Practical judgment, persistence and communication style.
That is why DISC Personalities offers four tests rather than one: DISC, IQ, EQ and Left/Right Brain. If your IQ result leaves you wanting a fuller picture, the EQ test looks at emotional awareness and regulation, and the Left/Right Brain test explores your thinking style.

How Should Schools and Employers Use an IQ Score Chart?
Schools and employers should use an IQ score chart as one input among several. Placement and hiring decisions work better when a score sits alongside grades, structured interviews, work samples and skills checks, and when the test is appropriate for the purpose, properly supervised and fairly administered to everyone.
In schools, gifted and special education decisions usually combine a supervised test with classroom performance, teacher observations and parent input. A single online score is not a substitute for that process. Parents who want to understand a child's learning needs can ask the school psychologist which test was used and what the confidence interval is.
In the workplace, cognitive scores should never be the sole basis for hiring, promotion or termination. Employers in the US should follow guidance from the Equal Employment Opportunity Commission (EEOC) on employment testing, which expects tests to be related to the job and used consistently. This article is general information, not legal advice.
For team development rather than selection cutoffs, Business Suite from DISC Personalities is designed for HR teams and team leaders. It helps them see how DISC and IQ results are distributed across a team, which can support conversations about communication, training and role design.
What About Celebrity IQ Scores Like Oprah Winfrey's?
Most celebrity IQ scores are not verified. Oprah Winfrey has no publicly verified IQ score, and the numbers attached to her name online come from unsourced lists rather than a published test record. The same applies to many famous names, including Albert Einstein, who has no known record of taking an IQ test.
Many historical "IQ scores" come from estimates, not tests. In 1926, psychologist Catharine Cox estimated the childhood IQs of 300 historical figures from biographies, and some of those estimates still circulate as if they were measured. Other figures come from celebrity listicles or from textbook exercises that use a famous name as an example.
You can check any IQ claim you see online with a few questions:
- Is the test named? A real score comes from a specific test and edition.
- Is there a date and a source? Interviews, biographies or official records should be traceable.
- Is the number above a test's ceiling? Claims above 160 are hard to support on modern tests.
- Is it an estimate? Retroactive estimates are interesting history, not measurements.
Celebrity numbers also invite unhelpful comparisons. Your score describes your performance against people your age on a particular test. It is not a ranking against famous people, and it does not decide what you can achieve.

Frequently Asked Questions About IQ Score Charts
What is a good IQ score?
A good IQ score is generally 90 or higher, the start of the Average range that covers about half of all people. Scores of 110 to 119 are High Average and beat about three in four people, while 120 or higher beats about nine in ten. There is no official cutoff, so the purpose matters.
What is a good IQ score by age?
A good IQ score is the same at every age because IQ tests compare you only with people your own age. The average is 100 for children, adults and older adults alike, and 110 is above average in every group. Raw reasoning ability changes with age, but the scaled score accounts for that.
How smart is 120 IQ?
An IQ of 120 is well above average and sits at about the 91st percentile, higher than roughly 91 of every 100 people. Most tests label it Superior or Very High. About 1 in 11 people score 120 or higher, and it falls 10 points below the 130 line many gifted programs use.
What is Oprah Winfrey's IQ?
Oprah Winfrey has no publicly verified IQ score. Figures such as 140 or 150 that appear online come from unsourced celebrity lists or teaching examples, not from a published test result. Without a named test, date and source, any IQ number attached to a public figure should be treated as speculation.
What is an IQ score chart?
An IQ score chart is a table that shows what an IQ score means by listing its range, descriptive level, percentile and share of the population. Most charts use a scale with an average of 100 and a standard deviation of 15, where about 68% of people score between 85 and 115.
What is the average IQ score?
The average IQ score is 100 by design. Test publishers set the mean of their norm group at 100 and renorm tests every 10 to 20 years to keep it there. About half of all people score between 90 and 109, the range most charts label Average.
What percentage of people have an IQ over 130?
About 2.2% of people have an IQ of 130 or higher on a scale with a standard deviation of 15, roughly 1 in 44. A score of 130 sits near the 98th percentile. On tests that use a different standard deviation, the same rarity corresponds to a different number, such as 132 or 148.
What IQ score do you need for Mensa?
Mensa International requires a score at or above the 98th percentile on an approved, supervised intelligence test. On Wechsler tests that equals about 130, on older Stanford-Binet forms about 132, and on the Cattell scale about 148. Unsupervised online scores are not accepted for membership.
Are online IQ test scores accurate?
Online IQ test scores are rough indicators rather than precise measurements. They use fewer items, often rely on web-based norm groups and run without supervision, so their margin of error is wider than a clinical test's. Read an online result as a range of about 10 points either side and confirm it professionally when a decision depends on it.
Can your IQ score change over time?
Yes, IQ scores can change, especially in childhood. Education, health, sleep, practice with similar tests and testing conditions all affect results. Research suggests each extra year of schooling adds about 1 to 5 points. In adulthood, full-scale scores are fairly stable, though the abilities behind them shift with age.
What Should You Take Away From an IQ Score Chart?
An IQ score chart is most useful when you read it as a map of probabilities rather than a measure of worth. Your score shows where one performance landed among people your age, with a margin of error around it and many important abilities outside it. Use the percentile, widen the number into a range and pair it with what you know about your emotional skills and working style. If you want a starting point, take the free IQ test on discpersonalities.com and read your basic result against this chart. Tests on the site have been completed more than 109,000 times, and according to discpersonalities.com data, 91.2% of users reported positive feedback on accuracy.
- Website: DISC Personalities
- Email: admin@discpersonalities.com


DISC Team is a content writing team for tracnghiemtinhcach.vn, focusing on the DISC model, communication styles, and teamwork. The team aims to explain concepts in accessible language, helping readers connect them with situations in their work and everyday lives.
View author profile

Don't Let Your Potential Stay Hidden!
Take the DISC test today and discover your unique 'YOU', with deep insights into your true personality and potential.
 Understand yourself
 Choose the right career
 Suggest effective communication
 Reduce negative emotions
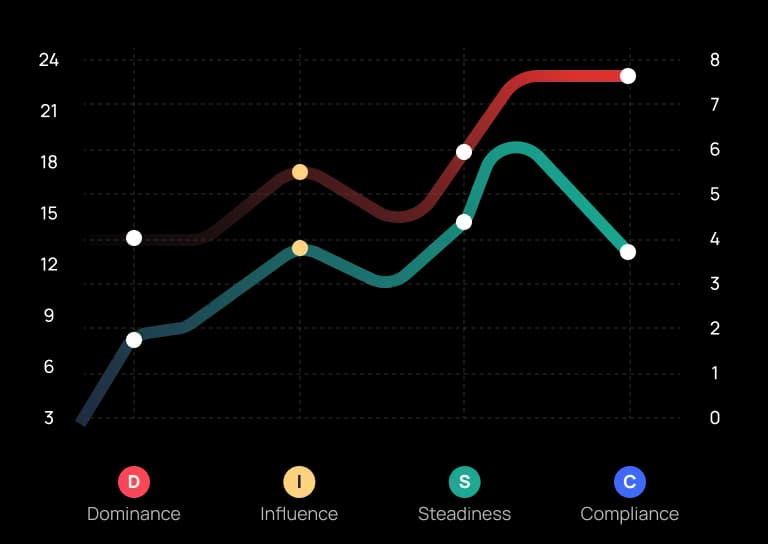
Represents your instinctive behaviors and desires.
Shows the behavioral tendencies you think you should exhibit in specific situations.
Related articles
You may also be interested in
 IQ, EQSep 25, 2026
Why Emotional Intelligence in the Workplace Matters for Leaders
Emotional intelligence in the workplace helps leaders handle difficult conversations, organizational change, employee concerns, collaboration, and conflict.
 IQ, EQSep 22, 2026
Emotional Intelligence and Conflict Resolution: A Practical Guide
Learn how emotional intelligence supports conflict resolution through self-regulation, active listening, empathy, and clear communication.
 IQ, EQSep 22, 2026
What Is a Low IQ Score? Meaning, Ranges, and What It Indicates
Learn what a low IQ score means, where different IQ ranges fall, and why IQ alone cannot determine intelligence, ability, or everyday functioning.
